This site is intended for health professionals only
Read the latest issue online
Climbing the leadership ladder
The Department of Health and Social Care (DHSC) has published a revision to a graph illustrating trends in nurses’ pay that was criticised for misrepresenting wage increases, months after the graph was originally criticised by the UK statistics watchdog.
Sir Robert Chote, chair of the UK Statistics Authority, had called the graph in a tweet from the DHSC’s official account a ‘poor and misleading representation’ of nurses’ pay when it was published in December.
DHSC has now published a revised version of the graph in a series of ‘explanatory notes’.
However, the DHSC’s latest publication does not acknowledge that the previous graph was misleading nor does it acknowledge any of Sir Robert Chote’s judgements.
Steven Nowottny, editor at fact-checking organisation and anti-misinformation group Full Fact, commented that ‘It shouldn’t have taken the Department of Health and Social Care more than two months to publish this explanatory note, particularly when the graph’s potential to mislead was highlighted shortly after it was posted online.’
Mr Nowottny added that it was also ‘concerning’ that the original graph had not been taken down or corrected on the DHSC’s Twitter page, saying: ‘This means there is a risk people will still see the original post and not be aware of its shortcomings.
‘It’s crucial that graphs present data clearly and accurately, to avoid giving a misleading impression of the information which lies behind them. And if misleading information is posted online, it’s crucial that it’s quickly and prominently corrected to avoid misinformation spreading.’
Why was the graph called ‘misleading’?
The original graph, below, was tweeted from the official DHSC account under the title ‘How nurse pay has increased’. This appeared to show that nurses’ pay had increased quite rapidly since 2020, especially for newly qualified nurses. 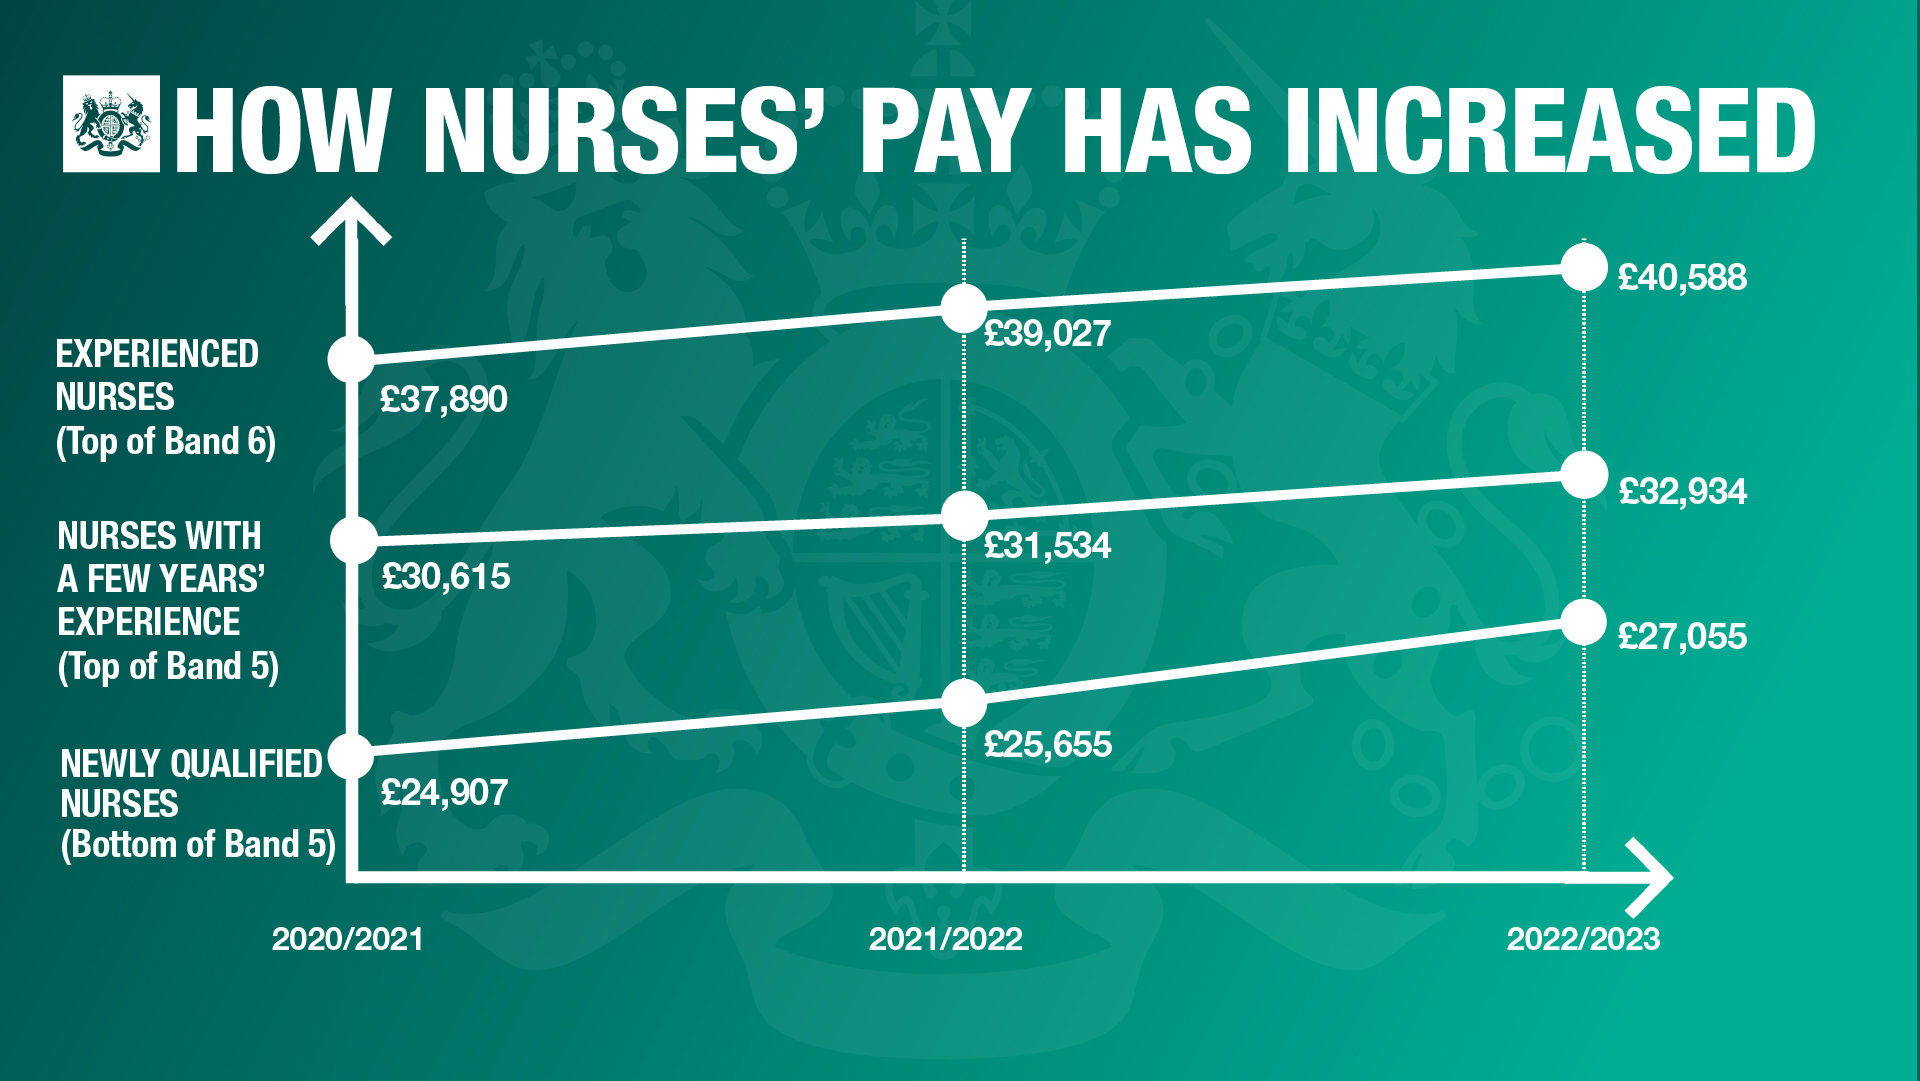
This graph was criticised because the vertical axis starts at £20,000. Sir Chote said that this ‘exaggerates the proportionate increase in pay over the period,’ adding that ‘the freehand way in which the lines appear to have been drawn suggests a bigger relative increase in pay for newly qualified nurses and a bigger pay premium for a “few years’ experience” than the underlying data justify’.
In the new explanatory note the DHSC makes no mention of these criticisms, However, the DHSC have included a corrected version of the graph. This graph shows nurses’ pay with proportional distances between the data points and an axis starting at 0.
The revised graph clearly shows a less pronounced increase in nurses pay across all bands.
The DHSC’s explanatory note also points out that the chart makes use of ‘nominal values’ for nurses’ pay. This means that the values have not been adjusted for inflation, saying: ‘this is the way that terms and conditions are contractually defined, how pay review body recommendations and outcomes are routinely expressed.’
See how our symptom tool can help you make better sense of patient presentations
Click here to search a symptom
Receive the latest news, clinical updates and case studies straight to your inbox.
SIGN UP TODAY
Visit Nursing in Practice Reference for details on 140 symptoms, including easily searchable symptoms and categories, offering you a free platform to check symptoms or search by category during a consultation to look for guidance on next steps.
1Ten top tips: Hypertension diagnosis and management
2How to manage genitourinary symptoms of menopause
3Syphilis – don’t miss it!
4Study focuses on low carbohydrate diet in 12-month ‘window’ following diabetes diagnosis
Enjoy the best experience with our mobile app
Other links
Join the discussion and be a part of Nursing in Practice
Download Nursing in Practice free app
Download free symptom tool app
© Cogora 2023
Cogora Limited. 1 Giltspur Street, London EC1A 9DD Registered in the United Kingdom. Reg. No. 2147432